A very Happy 2015 to all our readers. To kick off the new year, we bring you a new segment of notes from the field, this time from the USA, where Amy Uhrin writes about the research work going on in the eelgrass beds of Beaufort, North Carolina. Amy is a Research Ecologist with the National Oceanic and Atmospheric Administration (NOAA). Her research focuses on the influence of natural physical disturbances (e.g., hurricanes, wind waves, tidal currents) and human-influenced disturbances (e.g., vessel groundings, fishing gear) on seagrass seascapes and how seagrass spatial configuration may serve as an indicator of system vulnerability and resilience. Amy is also a PhD candidate in the Ecosystem and Landscape Ecology Lab of Dr. Monica Turner at the University of Wisconsin-Madison.
Text and photos by Amy V. Uhrin
—————————————————-
The Albemarle-Pamlico Sound Estuary System in North Carolina is the second largest estuary in the United States. The Albemarle-Pamlico Sound Estuary System is a coastal lagoon bordered on the east and south by a chain of barrier islands (Outer Banks). Broad shallows, less than 2-meters deep at mean lower low water, are punctuated by relatively few deeper basins and channels. Seagrass beds along this portion of the North Carolina coast cover ~7000 hectares in a nearly continuous, ~1 km swath behind the extensive barrier island system.
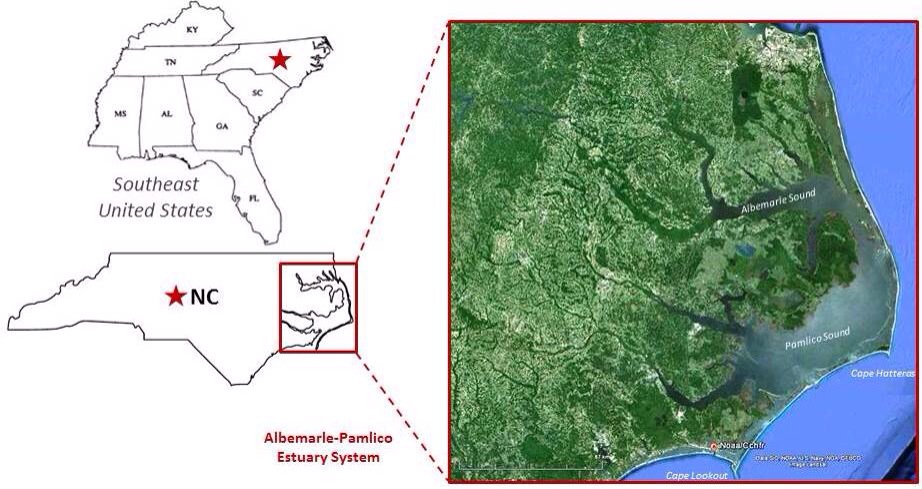
Figure 1 – The location of the Albemarle-Pamlico Sound Estuary System relative to the State of North Carolina and the southeastern United States.
The beds are dominated by a mixture of two species, Zostera marina (eelgrass) and Halodule wrightii (shoalgrass), with seasonally abundant Ruppia maritima (widgeongrass) in quiescent areas. This region represents the southern geographic limit of Z. marina and the northern geographic limit of H. wrightii on the east coast of North America and is the only known overlapping acreage of these two species in the world. H. wrightii has higher tolerances to fluctuations in light and water temperature than Z. marina, and so it has been suggested that the Albemarle-Pamlico Sound Estuary System could revert to a Halodule-dominated system over time as a result of climate change (i.e., increasing water temperature and sea level rise). Therefore, we have embarked on a field study to evaluate changes in the seagrass community (shoot density, biomass, species composition) over the last 20+ years.
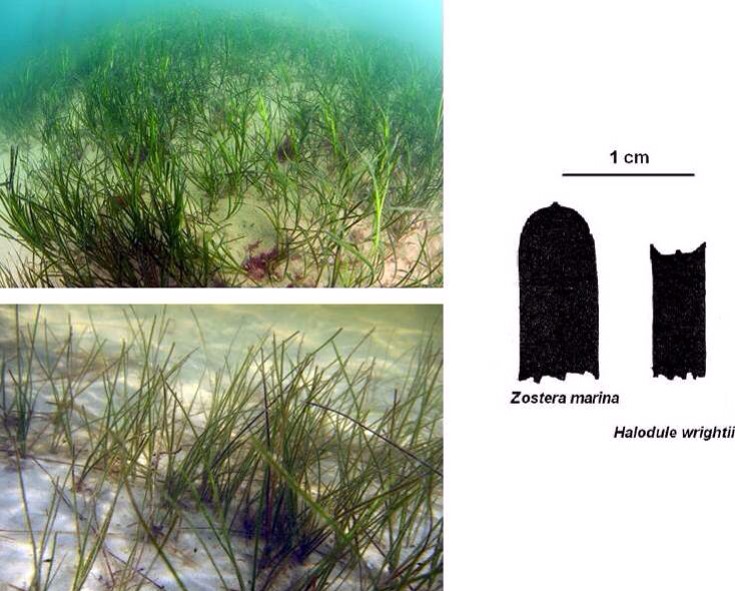
Figure 2 – Zostera marina (top) and Halodule wrightii (bottom). Visually, the two species appear very similar (strap-like blades) but are easily distinguished by their differing blades tips, blade widths, and rhizome structures.
The field study involves sampling at 10 historic study sites which were thoroughly evaluated in 1992 by staff here at NOAA’s Center for Coastal Fisheries and Habitat Research (CCFHR) in Beaufort, North Carolina. The 10 sites exist along an increasing gradient of tidal current speed and wind-wave exposure which results in seagrass seascapes ranging from continuous meadows (extending tens of kilometers) to aggregations of patchy mounds (less than a meter across).
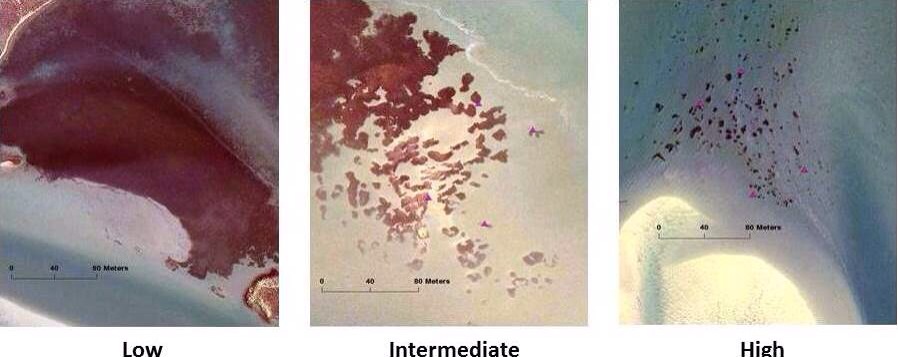
Figure 3 – Seagrass seascapes in coastal North Carolina range from continuous meadows to patchy seagrass as a result of increasing hydrodynamic stress.
The project was initiated in 2013. This past spring and summer we collected our second set of field data. Because the two seagrass species achieve peak biomass at different times of the year, we must sample in late May to early June for Z. marina and again in late August to early September for H. wrightii. The patchy sites are mapped by physically tracing the perimeters of all seagrass patches located within a 50 x 100 meter area using a handheld GPS unit.
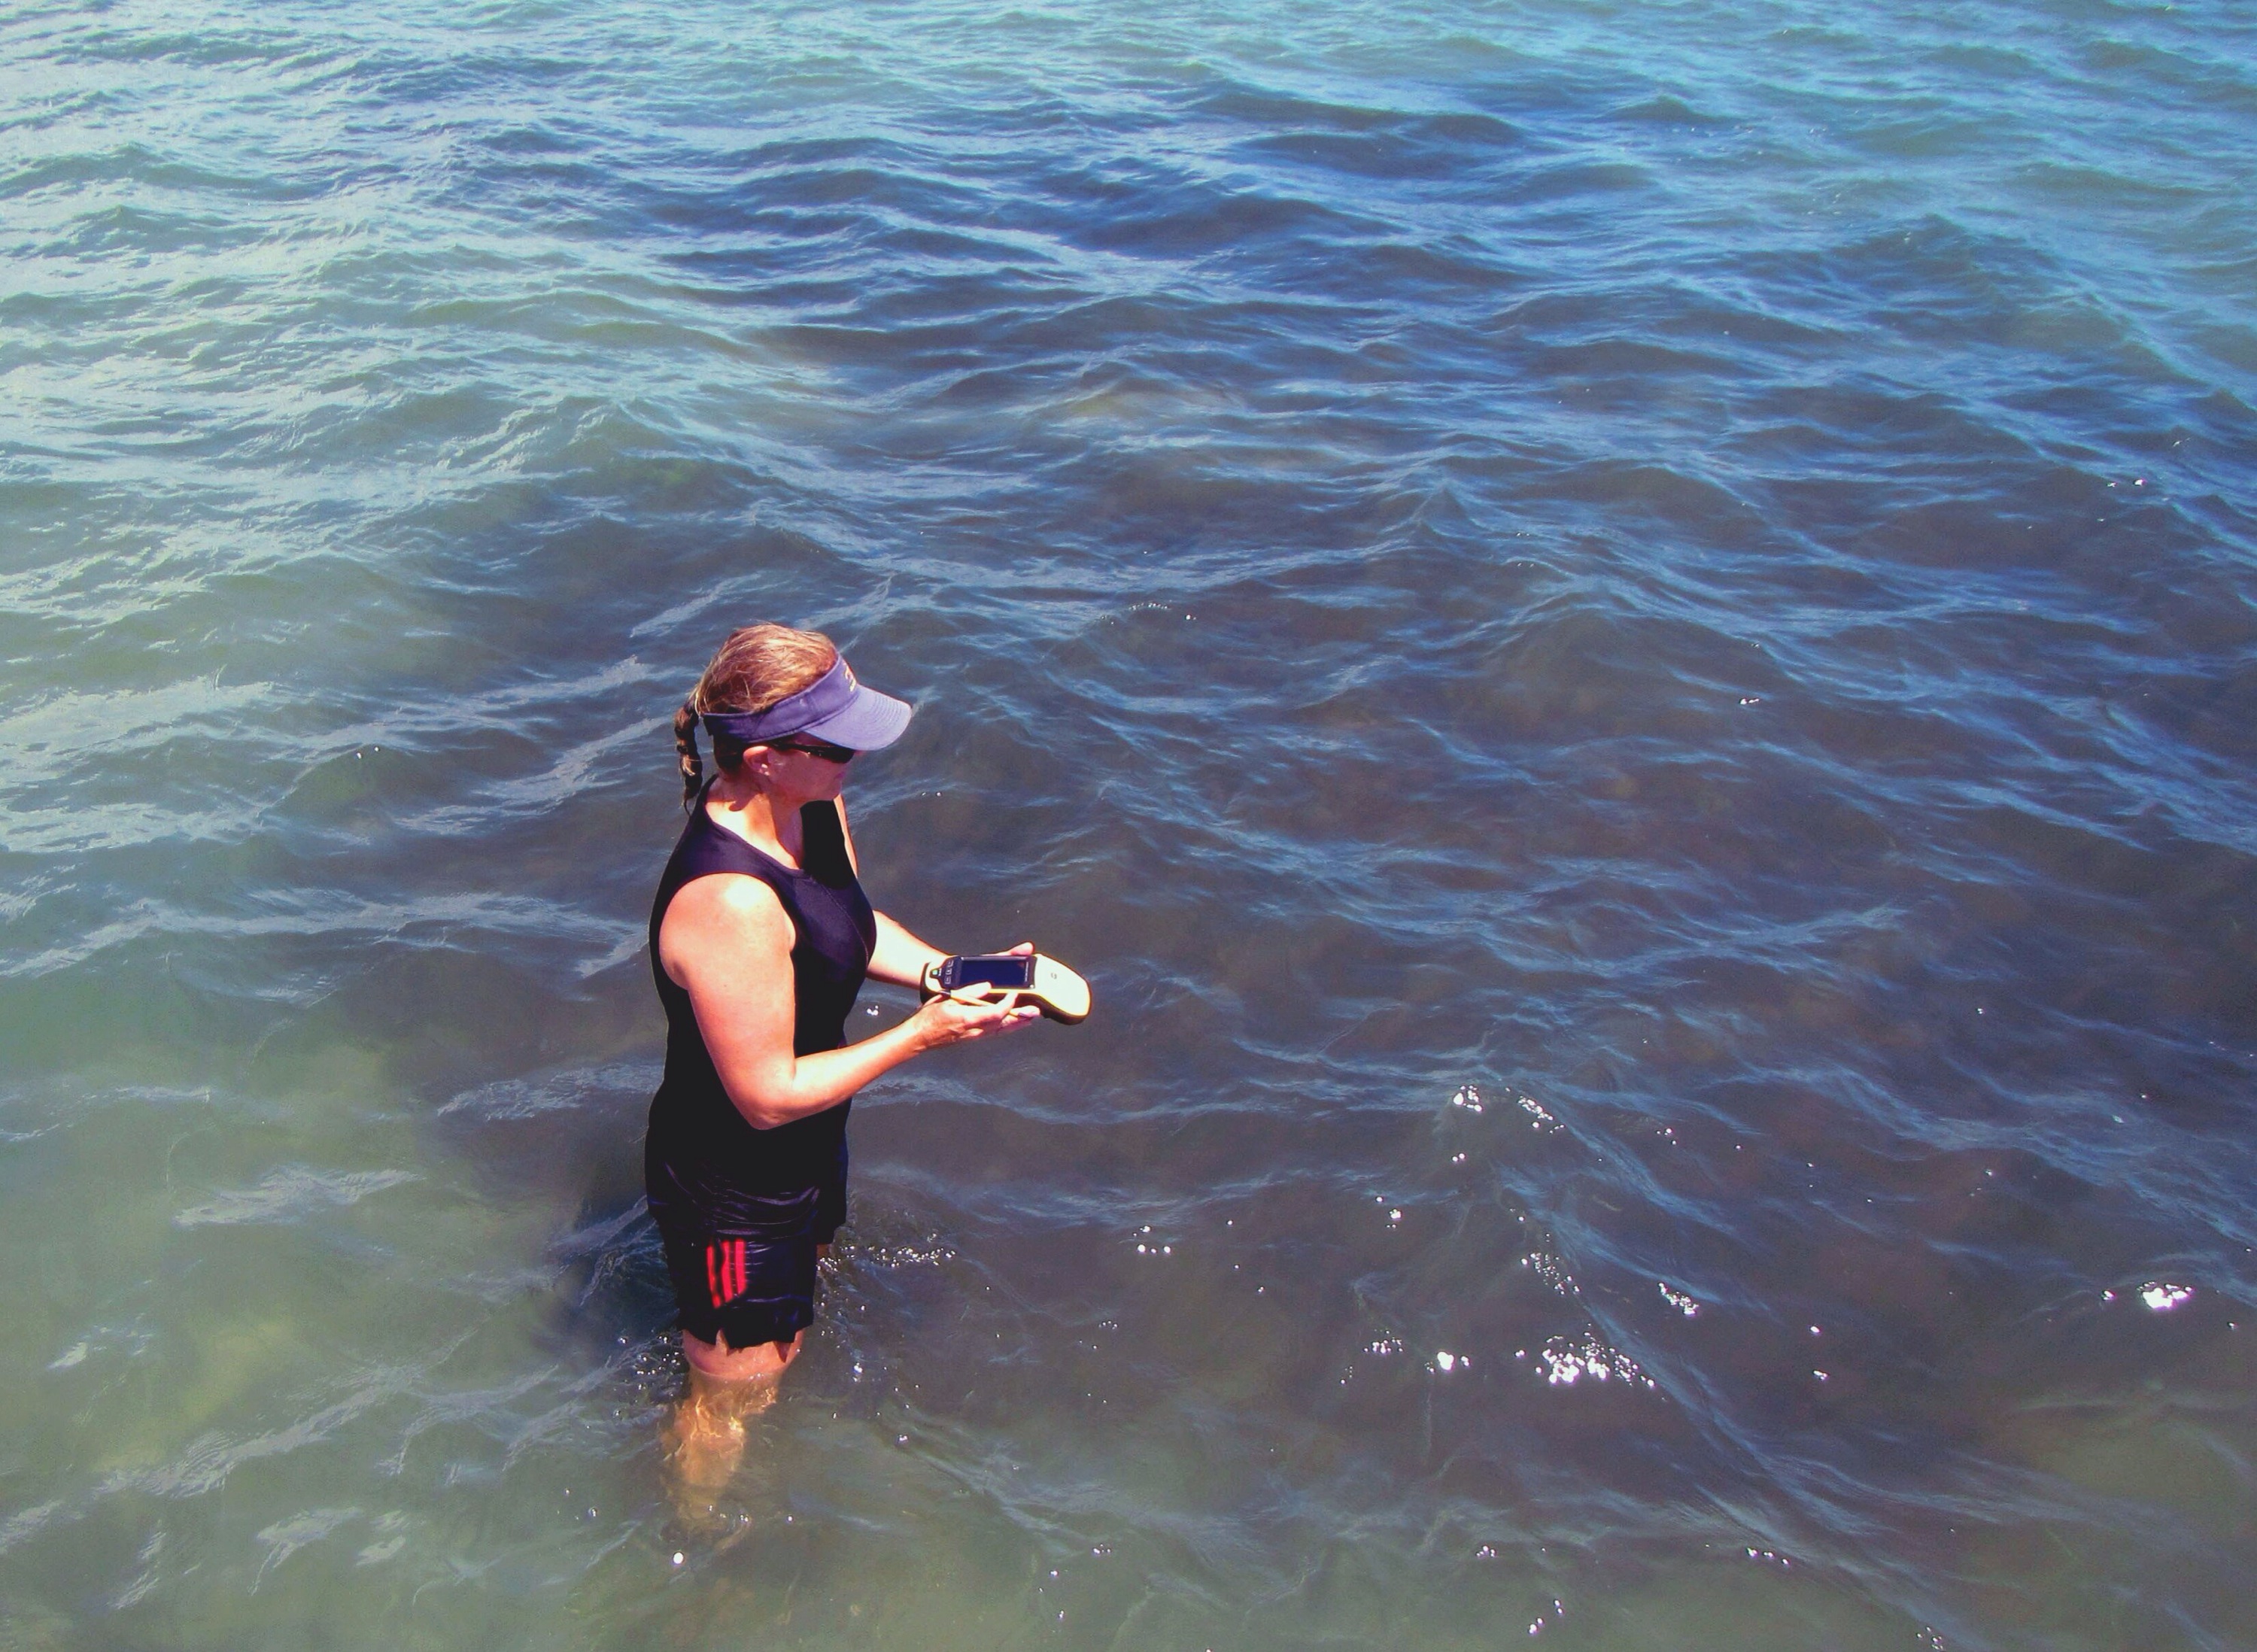
Figure 4 – Here, lead PI Amy Uhrin traces the perimeter of a seagrass patch using a handheld GPS unit.
We also conducted elevation surveys at patchy sites using Real Time Kinematic (RTK) GPS. The elevation surveys require that an off-site GPS base receiver station is established within 5 kilometers of the study site in conjunction with an existing local reference benchmark (a geographic point whose coordinates and/or elevation has been measured and recorded to a high level of accuracy). The benchmark is linked to a local tidal datum using NGS VDatum utility. The local tidal datum is then used as a reference to measure local water levels. The GPS errors calculated at the reference base station are radio broadcast to the GPS rover receiver being used at the study site. The rover receiver also collects its own set of coordinates which are then corrected on the fly relative to the reference benchmark. After post-processing, this results in a submerged, topographic map of the seagrass patches with centimeter-level vertical accuracy.
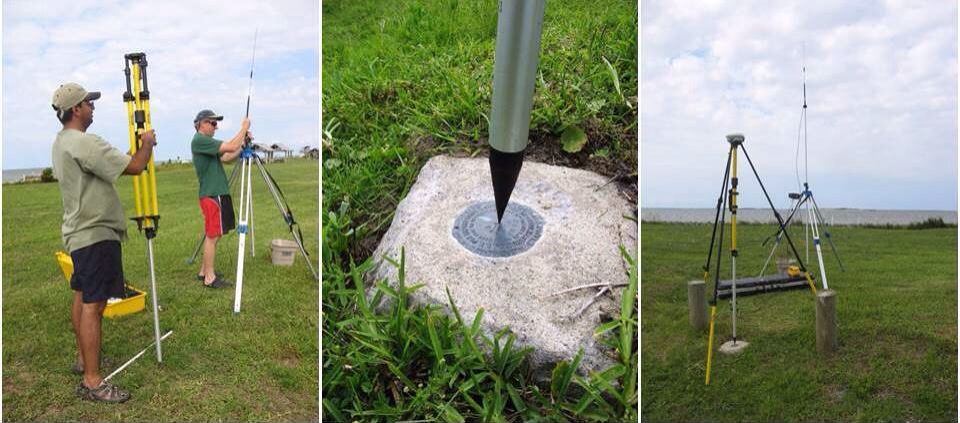
Figure 5 – CCFHR staff Amit Malhotra and Don Field install the off-site base station and radio antenna (left). The base station antenna is positioned directly over the existing GPS benchmark (middle). The final antenna arrangement is shown in the photo at the right.
A key limitation of conducting surveys via RTK GPS is that the antenna for the rover receiver must be in contact with the surface of the substrate at all times because coordinates are collected continuously at one-second intervals. For our surveys, we adopted an innovative technique that developed at our lab for use in salt marsh elevation surveys where the GPS antenna for the rover receiver is mounted to a bicycle that is manually maneuvered by hand across the study site following a grid pattern to ensure far-reaching coverage of data points.
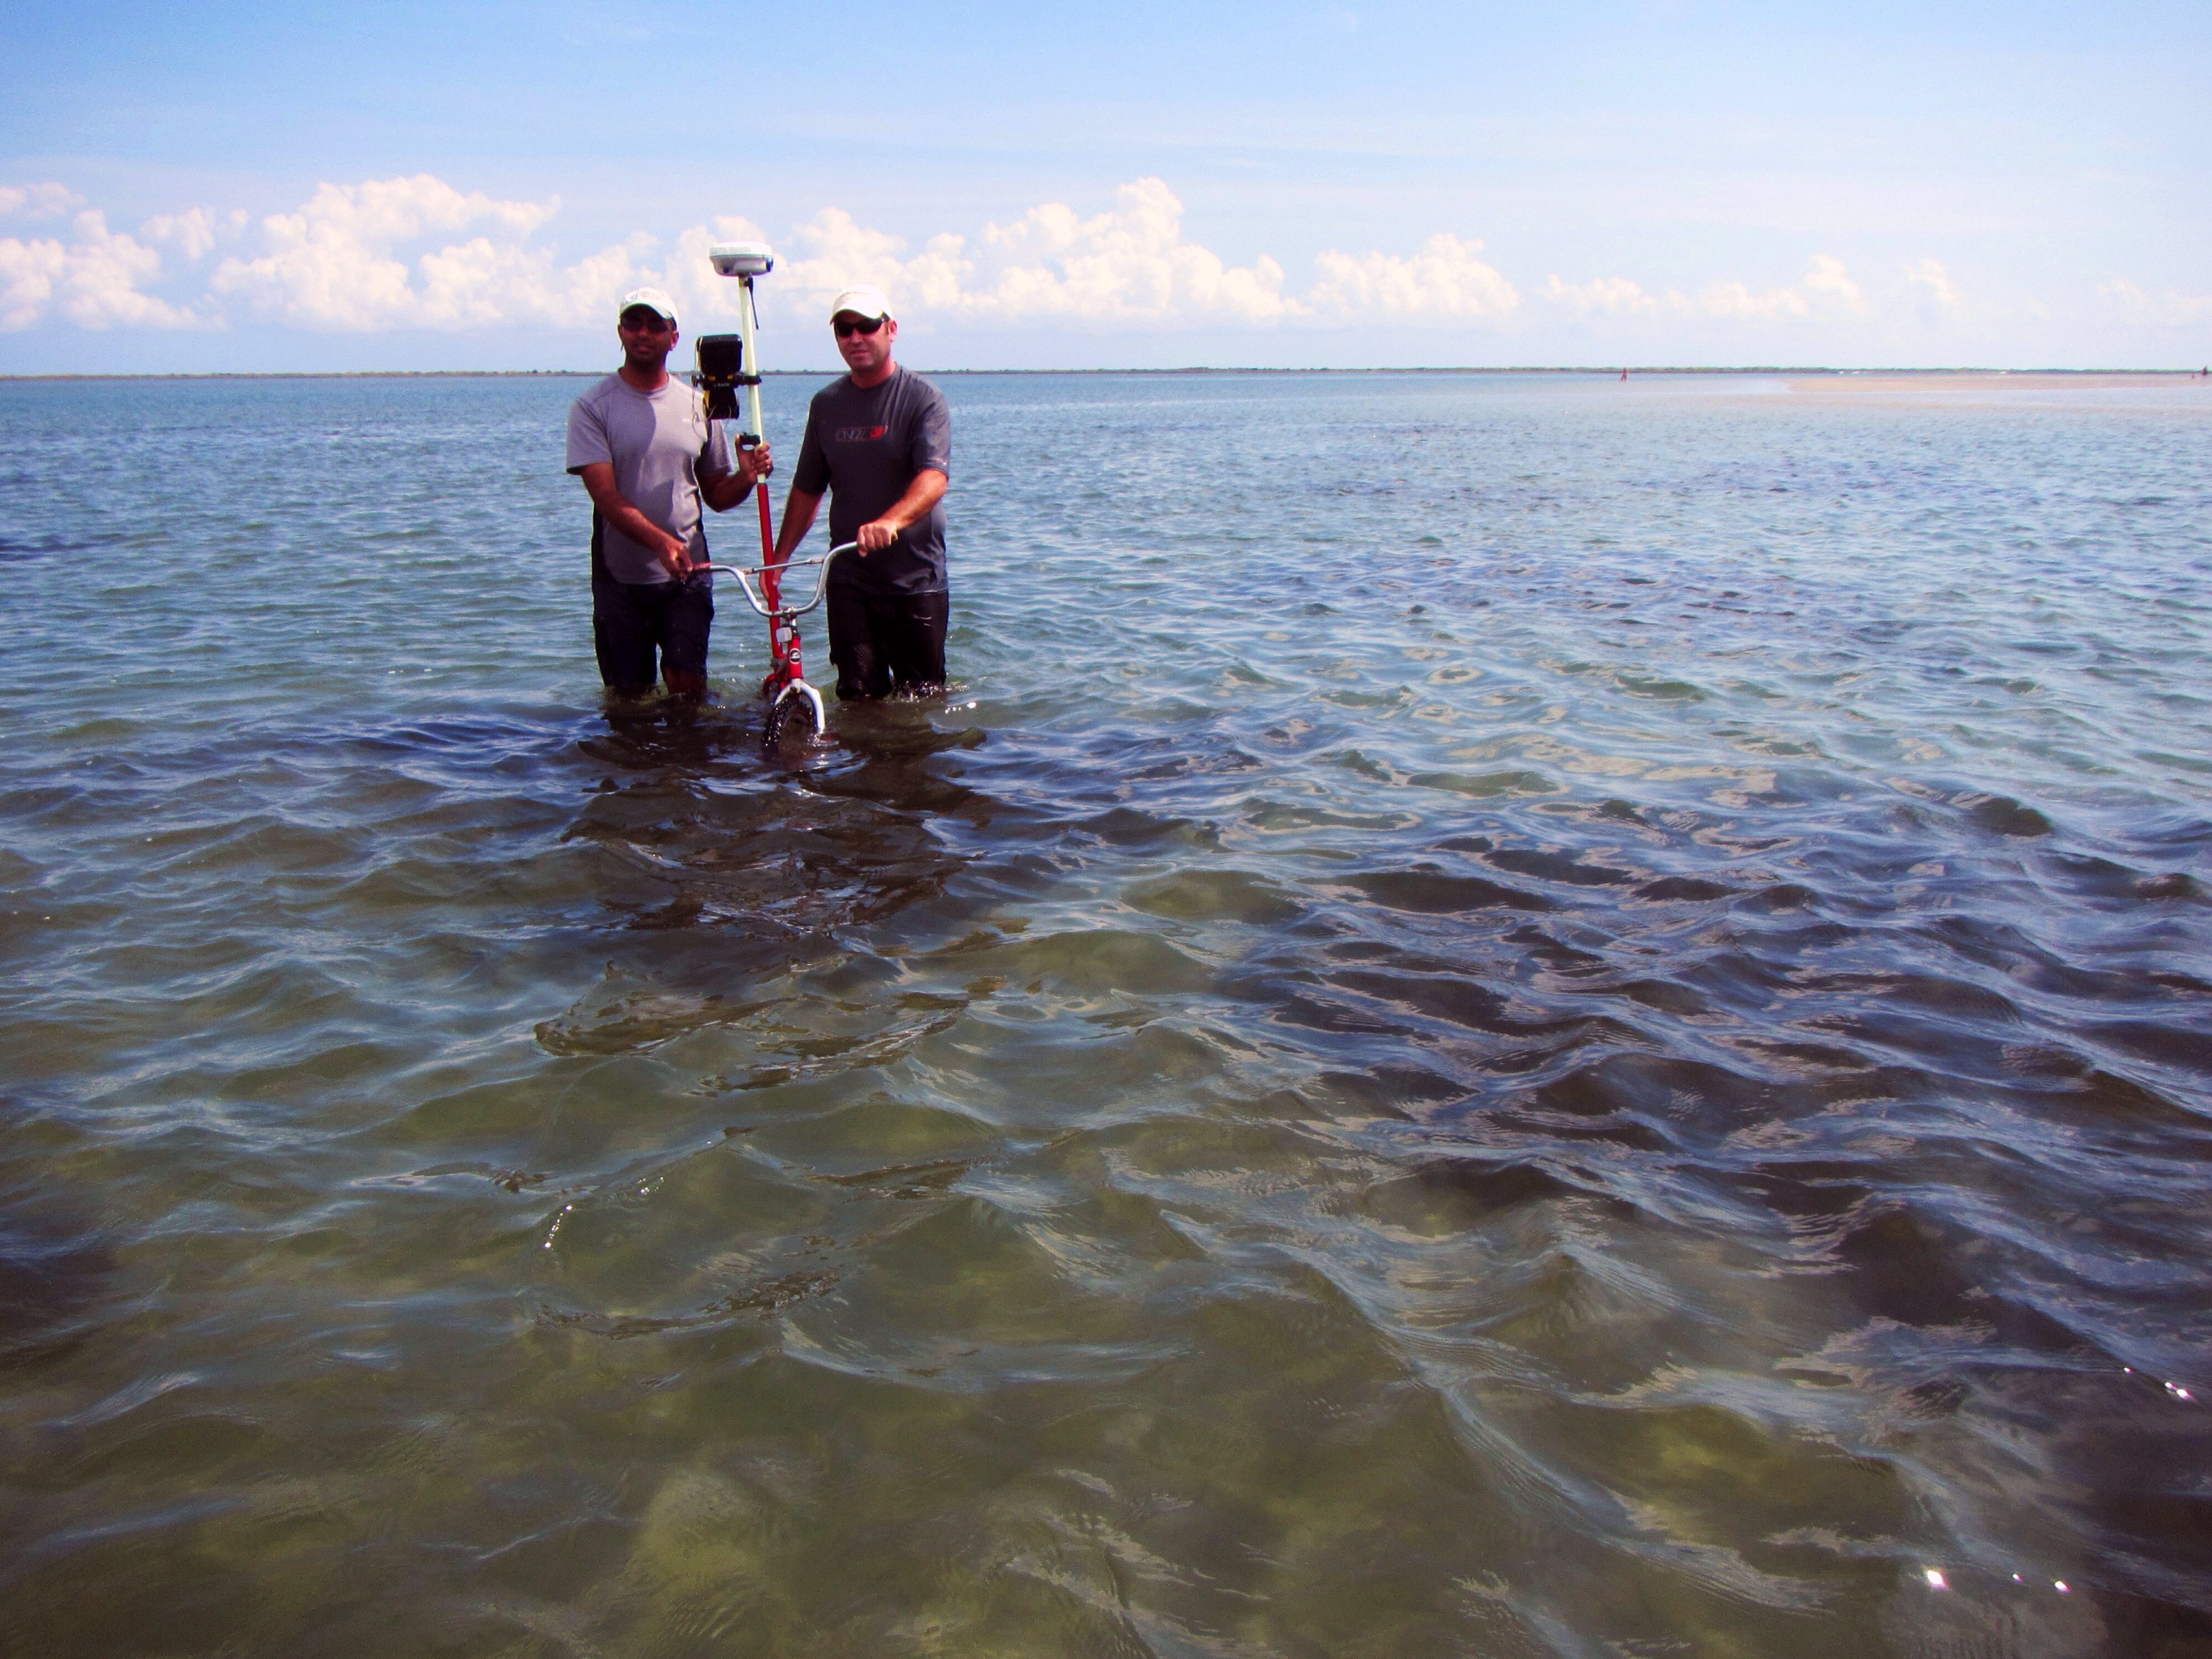
Figure 6 – CCFHR staff Amit Malhotra and Troy Rezek maneuver the bicycle with attached antenna across seagrass patches at one of our study sites.
In addition to mapping, we performed Braun-Blanquet estimates of percent cover and extract core samples for measuring shoot density, leaf lengths, and above- and belowground biomass and for determination of species composition at all sites. Water depth is variable at the sites which can create a sampling challenge. Although it is easier to extract cores in shallow water, estimating percent cover is not as easy when plants are exposed! In deeper water, we use a lot of breath holding to extract cores!

Figure 7 – Amy and Troy extract a seagrass core sample at a shallow water site (left). Core extraction is not as easy in deeper water when a mask and snorkel must be used as demonstrated by CCFHR staff Walt Rogers (middle). Don had a difficult time estimating percent cover at this particular site where the seagrass was emergent at low tide (right).
We were fortunate enough to have aerial imagery overflights by the North Carolina Department of Transportation take place during our 2013 sampling with coverage of all study sites. This imagery will be classified for seagrass using a semi-automated technique developed at our lab. The classified layers will be used to quantify differences in seagrass spatial patterns across hydrodynamic gradients and is an additional component of our research in the Albemarle-Pamlico Estuary System that seeks to quantify differences in seagrass spatial patterns across hydrodynamic gradients, identify thresholds in hydrodynamic drivers of seagrass spatial pattern, and examine how seagrass spatial pattern influences ecological resilience in the face of climate change, namely increasing severity and frequency of hurricanes.

Figure 8 – A panoramic view of one of our sites located at Middle Marsh North. This site experiences intermediate levels of tidal currents and wind-wave exposure which results in a seagrass seascape of elongated patches.
It is a wonderful research by which seagrass spatial configuration may serve as an indicator of system vulnerability and resilience. Thank you, Amy.